The page you were trying to view is not available for your role.
In order to aid your understanding, the underlined terms are hyperlinked to definitions in our online investment glossary.
Our market summary
May proved to be a strong month for global markets, as easing geopolitical tensions fed through to lower energy prices and improved sentiment. Hopes of progress in the Middle East drove a sharp fall in oil, helping to reduce inflation concerns. Together with a strong end to first quarter earnings season, this provided support to risk assets. Against this backdrop, global equities moved higher, with the MSCI AC World Index rising 6.1% in sterling terms. Bonds were more volatile, with yields rising earlier in the month before falling back as inflation expectations eased, leaving returns modestly positive overall.
US
US
US equities delivered solid gains, supported by continued strength in growth sectors. The MSCI USA Index rose 6.1% in sterling terms, with technology and AI‑related companies once again leading the market, although with clear selectivity and questions remaining over capital expenditure plans. Economic data remained resilient, reinforcing expectations that growth can continue without triggering a material deterioration in inflation. As a result, investor confidence improved, despite some mid-month volatility in bond markets.
The performance figures shown refer to past performance. Past performance is not a reliable indicator of future performance.
Europe
Europe
European equities also advanced, though performance was more moderate than in the US. The MSCI Europe ex UK Index returned 4.5% over the month. Markets benefited from the global risk-on backdrop and easing inflation concerns, although gains were tempered by ongoing uncertainty around growth momentum and interest rates. Within the region, growth stocks outperformed, reflecting a broader global trend.
The performance figures shown refer to past performance. Past performance is not a reliable indicator of future performance.
UK
UK
The UK lagged other developed markets, with the MSCI UK Index delivering a more modest return of 0.5%. The market’s heavier exposure to energy and healthcare stocks weighed on performance. Domestic factors also remained in focus, including political uncertainty and sensitivity to interest rate expectations. However, returns remained positive, supported by the consumer and basic materials sectors.
The performance figures shown refer to past performance. Past performance is not a reliable indicator of future performance.
Japan
Japan
Japanese equities continued their strong run, rising 5.8% in sterling terms. As an energy importer, the market benefited from signs of the Middle East conflict easing, as well as signs of improving economic momentum and positive earnings announcements. Japan’s exposure to global growth and cyclical sectors positioned it well to take advantage of improving sentiment.
The performance figures shown refer to past performance. Past performance is not a reliable indicator of future performance.
Emerging markets
Emerging markets
Emerging markets were among the best performers in May, with the MSCI Emerging Markets Index gaining 10.6%. Strength was driven largely by Korea and Taiwan, technology-focused markets that benefited from the continued enthusiasm around artificial intelligence and related hardware. However elsewhere performance was weaker, as a slow Chinese consumer economy continued to provide headwinds.
The performance figures shown refer to past performance. Past performance is not a reliable indicator of future performance.
Fixed income
Fixed income
Fixed income markets experienced a mixed but ultimately positive month. Yields rose to multi-year highs earlier in May before declining as oil prices fell and inflation concerns moderated. UK gilts delivered a return of around 2.0%, while sterling corporate bonds also gained close to 2.0%. Global bonds were more subdued, with the Bloomberg Global Aggregate (GBP hedged) returning 0.6%. Credit markets held up well, supported by the improved risk backdrop and ongoing demand for income.
The performance figures shown refer to past performance. Past performance is not a reliable indicator of future performance.
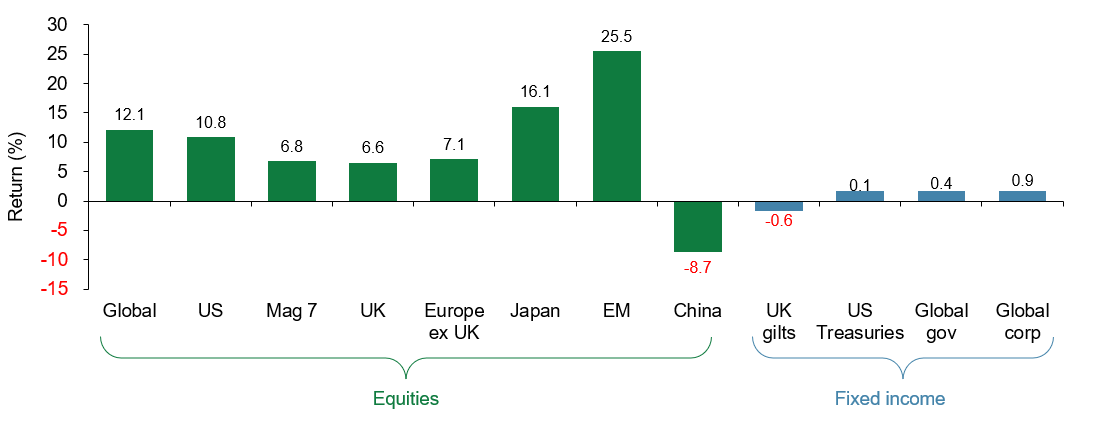
Source: Quilter as at 31 May 2026. Total return, percentage growth over period 30 April 2026 to 31 May 2026. Equities are represented by the appropriate MSCI index, the Magnificent Seven is represented by the Roundhill Magnificent Seven ETF, UK gilts is represented by the ICE BofA UK Gilt Index, US Treasuries is represented by the ICE BofA US Treasury (GBP Hedged) Index, global government bonds is represented by the Bloomberg Global Aggregate Government - Treasuries (GBP Hedged) Index, and global corporate bonds is represented by the Bloomberg Global Aggregate - Corporate (GBP Hedged) Index.
The performance figures shown refer to past performance. Past performance is not a reliable indicator of future performance.
Marcus Brookes
Chief Executive Officer and Chief Investment OfficerMarcus is both the Chief Executive Officer and Chief Investment Officer of Quilter Investors. Marcus joined Quilter Investors in December 2021 from Schroders Personal Wealth, where he also held the role of Chief Investment Officer. Marcus has considerable investment management experience with a deep understanding of the multi-asset sector, having managed multi-manager fund ranges for more than 25 years at Schroders, Cazenove Capital, Gartmore, and Insight Investments.
Important Information
The value of investments can fall as well as rise. You might get back less than you invested.
This communication is issued by Quilter, a trading name of Quilter Investment Platform Limited.
Approver: Quilter July 2026
QIP 23842/29/16653

