Data as at 18 March 2026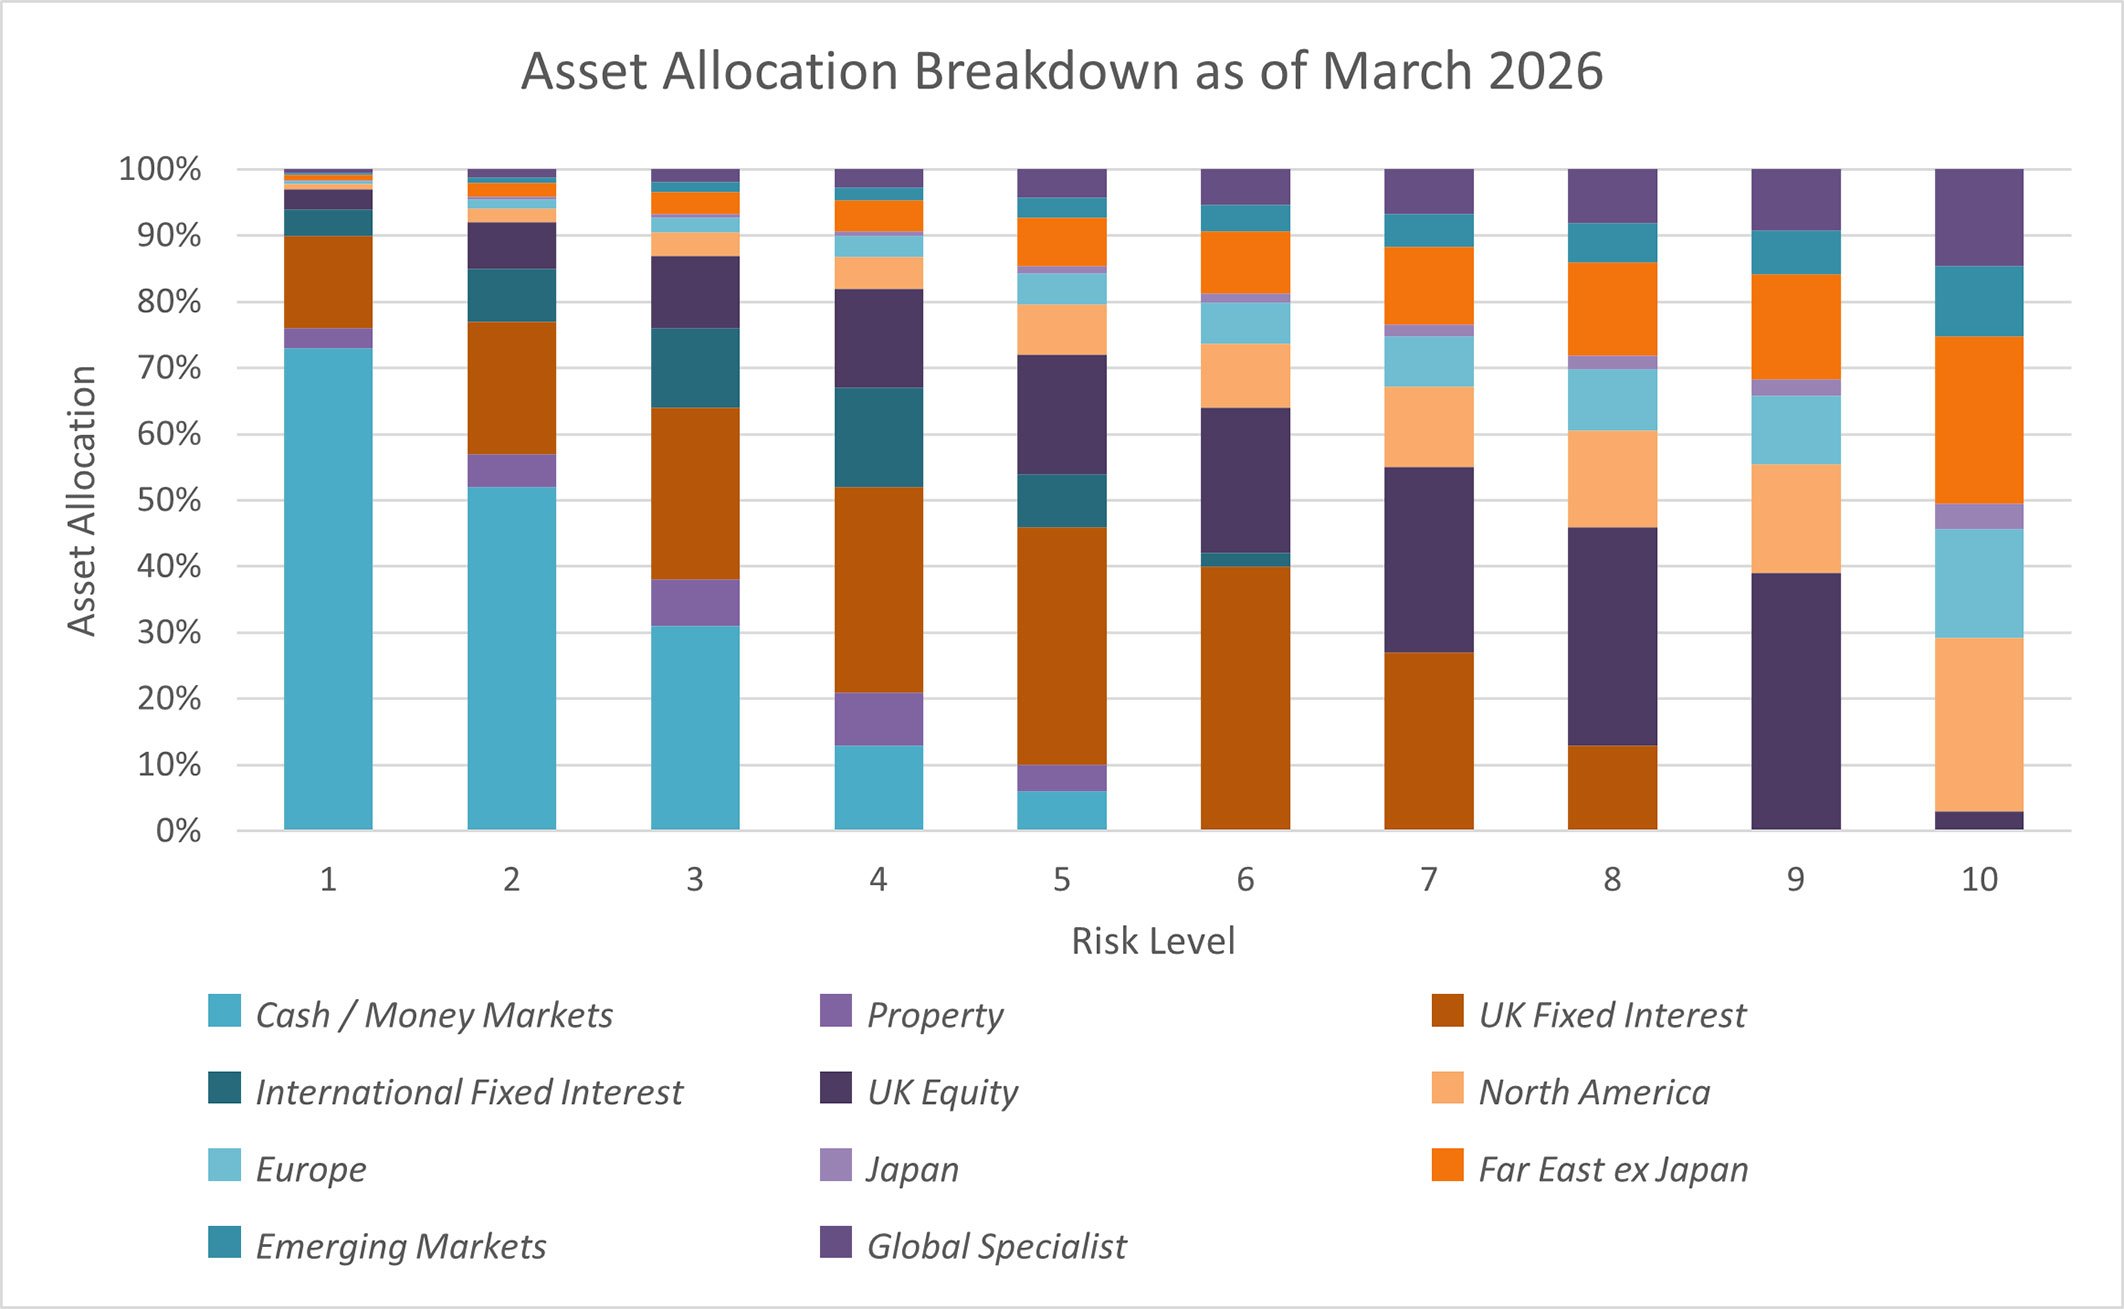
| Risk Level | 1 | 2 | 3 | 4 | 5 | 6 | 7 | 8 | 9 | 10 |
| Cash / Money Markets | 73.00% | 52.00% | 31.00% | 13.00% | 6.00% | - | - | - | - | - |
| Property | 3.00% | 5.00% | 7.00% | 8.00% | 4.00% | - | - | - | - | - |
| UK Fixed Interest | 14.00% | 20.00% | 26.00% | 31.00% | 36.00% | 40.00% | 27.00% | 13.00% | - | - |
| International Fixed Interest | 4.00% | 8.00% | 12.00% | 15.00% | 8.00% | 2.00% | - | - | - | - |
| UK Equity | 3.00% | 7.00% | 11.00% | 15.00% | 18.00% | 22.00% | 28.00% | 33.00% | 39.00% | 3.00% |
| North America | 0.81% | 2.16% | 3.51% | 4.86% | 7.56% | 9.72% | 12.15% | 14.58% | 16.47% | 26.19% |
| Europe | 0.51% | 1.36% | 2.21% | 3.06% | 4.76% | 6.12% | 7.65% | 9.18% | 10.37% | 16.49% |
| Japan | 0.12% | 0.32% | 0.52% | 0.72% | 1.12% | 1.44% | 1.80% | 2.16% | 2.44% | 3.88% |
| Far East ex Japan | 0.78% | 2.08% | 3.38% | 4.68% | 7.28% | 9.36% | 11.70% | 14.04% | 15.85% | 25.22% |
| Emerging Markets | 0.33% | 0.88% | 1.43% | 1.98% | 3.08% | 3.96% | 4.95% | 5.94% | 6.71% | 10.67% |
| Global Specialist | 0.45% | 1.20% | 1.95% | 2.70% | 4.20% | 5.40% | 6.75% | 8.10% | 9.15% | 14.55% |
| Total | 100.00% | 100.00% | 100.00% | 100.00% | 100.00% | 100.00% | 100.00% | 100.00% | 100.00% | 100.00% |