
The page you were trying to view is not available for your role.
Strategic asset allocations are used for the following investment solutions:
- Our WealthSelect Managed Portfolio Service (MPS).
- The portfolio construction tools available through our platform.
When you invest clients’ assets with us, you have access to risk-matched optimised asset allocations. These are produced in accordance with Modern Portfolio Theory (MPT) and are reviewed on a quarterly basis.
The process
The economic assumptions that underpin the financial models are verified by Willis Towers Watson. Their role is advisory and involves the production of a quarterly parameter review report.
The report examines the underlying assumptions used for the investment solutions listed above and, if required, recommends changes to them. Adjustments to these underlying assumptions may then result in changes to the asset allocations.
Whilst the theory and volatility targets underpinning these investment solutions are the same, the asset allocations for each may not be identical. Any variation will result from slight differences in the assumptions and how they are applied, for example:
- Asset allocation changes are likely to be implemented less quickly for a client’s portfolio than by a fund or portfolio manager with rebalancing done at potentially different times and frequencies.
- The return and correlation assumptions for WealthSelect MPS are more refined due to the limited number of funds available to the manager.
- The MPS Portfolios employ a dynamic approach to strategic asset allocation.
- There is a lower fee assumption for WealthSelect funds based on our negotiating power.
It is important to remember that the assumptions used are based on a longer-term view and may not necessarily reflect short-term idiosyncrasies of the markets. More specifically, the report covers the following.
- The return and volatility parameters for various asset classes.
- Correlations between returns on asset classes.
- The risk levels for each of the ten Quilter risk profiles.
- The appropriate geographical splits for international equities.
- A commentary on the rationale for any changes to parameters.
- Implied asset allocations for each of the risk levels.
More information
Risk mapping as at 18 September 2026
| Risk Level | 1 | 2 | 3 | 4 | 5 |
| Lower limit (inclusive) | 0.00% | 3.00% | 5.05% | 7.10% | 9.10% |
| Target volatility | 2.00% | 4.00% | 6.10% | 8.10% | 10.10% |
| Upper limit (exclusive) | 3.00% | 5.05% | 7.10% | 9.10% | 11.10% |
| Risk Level | 6 | 7 | 8 | 9 | 10 |
| Lower limit (inclusive) | 11.10% | 13.10% | 15.10% | 17.10% | 19.15% |
| Target volatility | 12.10% | 14.10% | 16.10% | 18.10% | 20.20% |
| Upper limit (exclusive) | 13.10% | 15.10% | 17.10% | 19.15% | 21.25% |
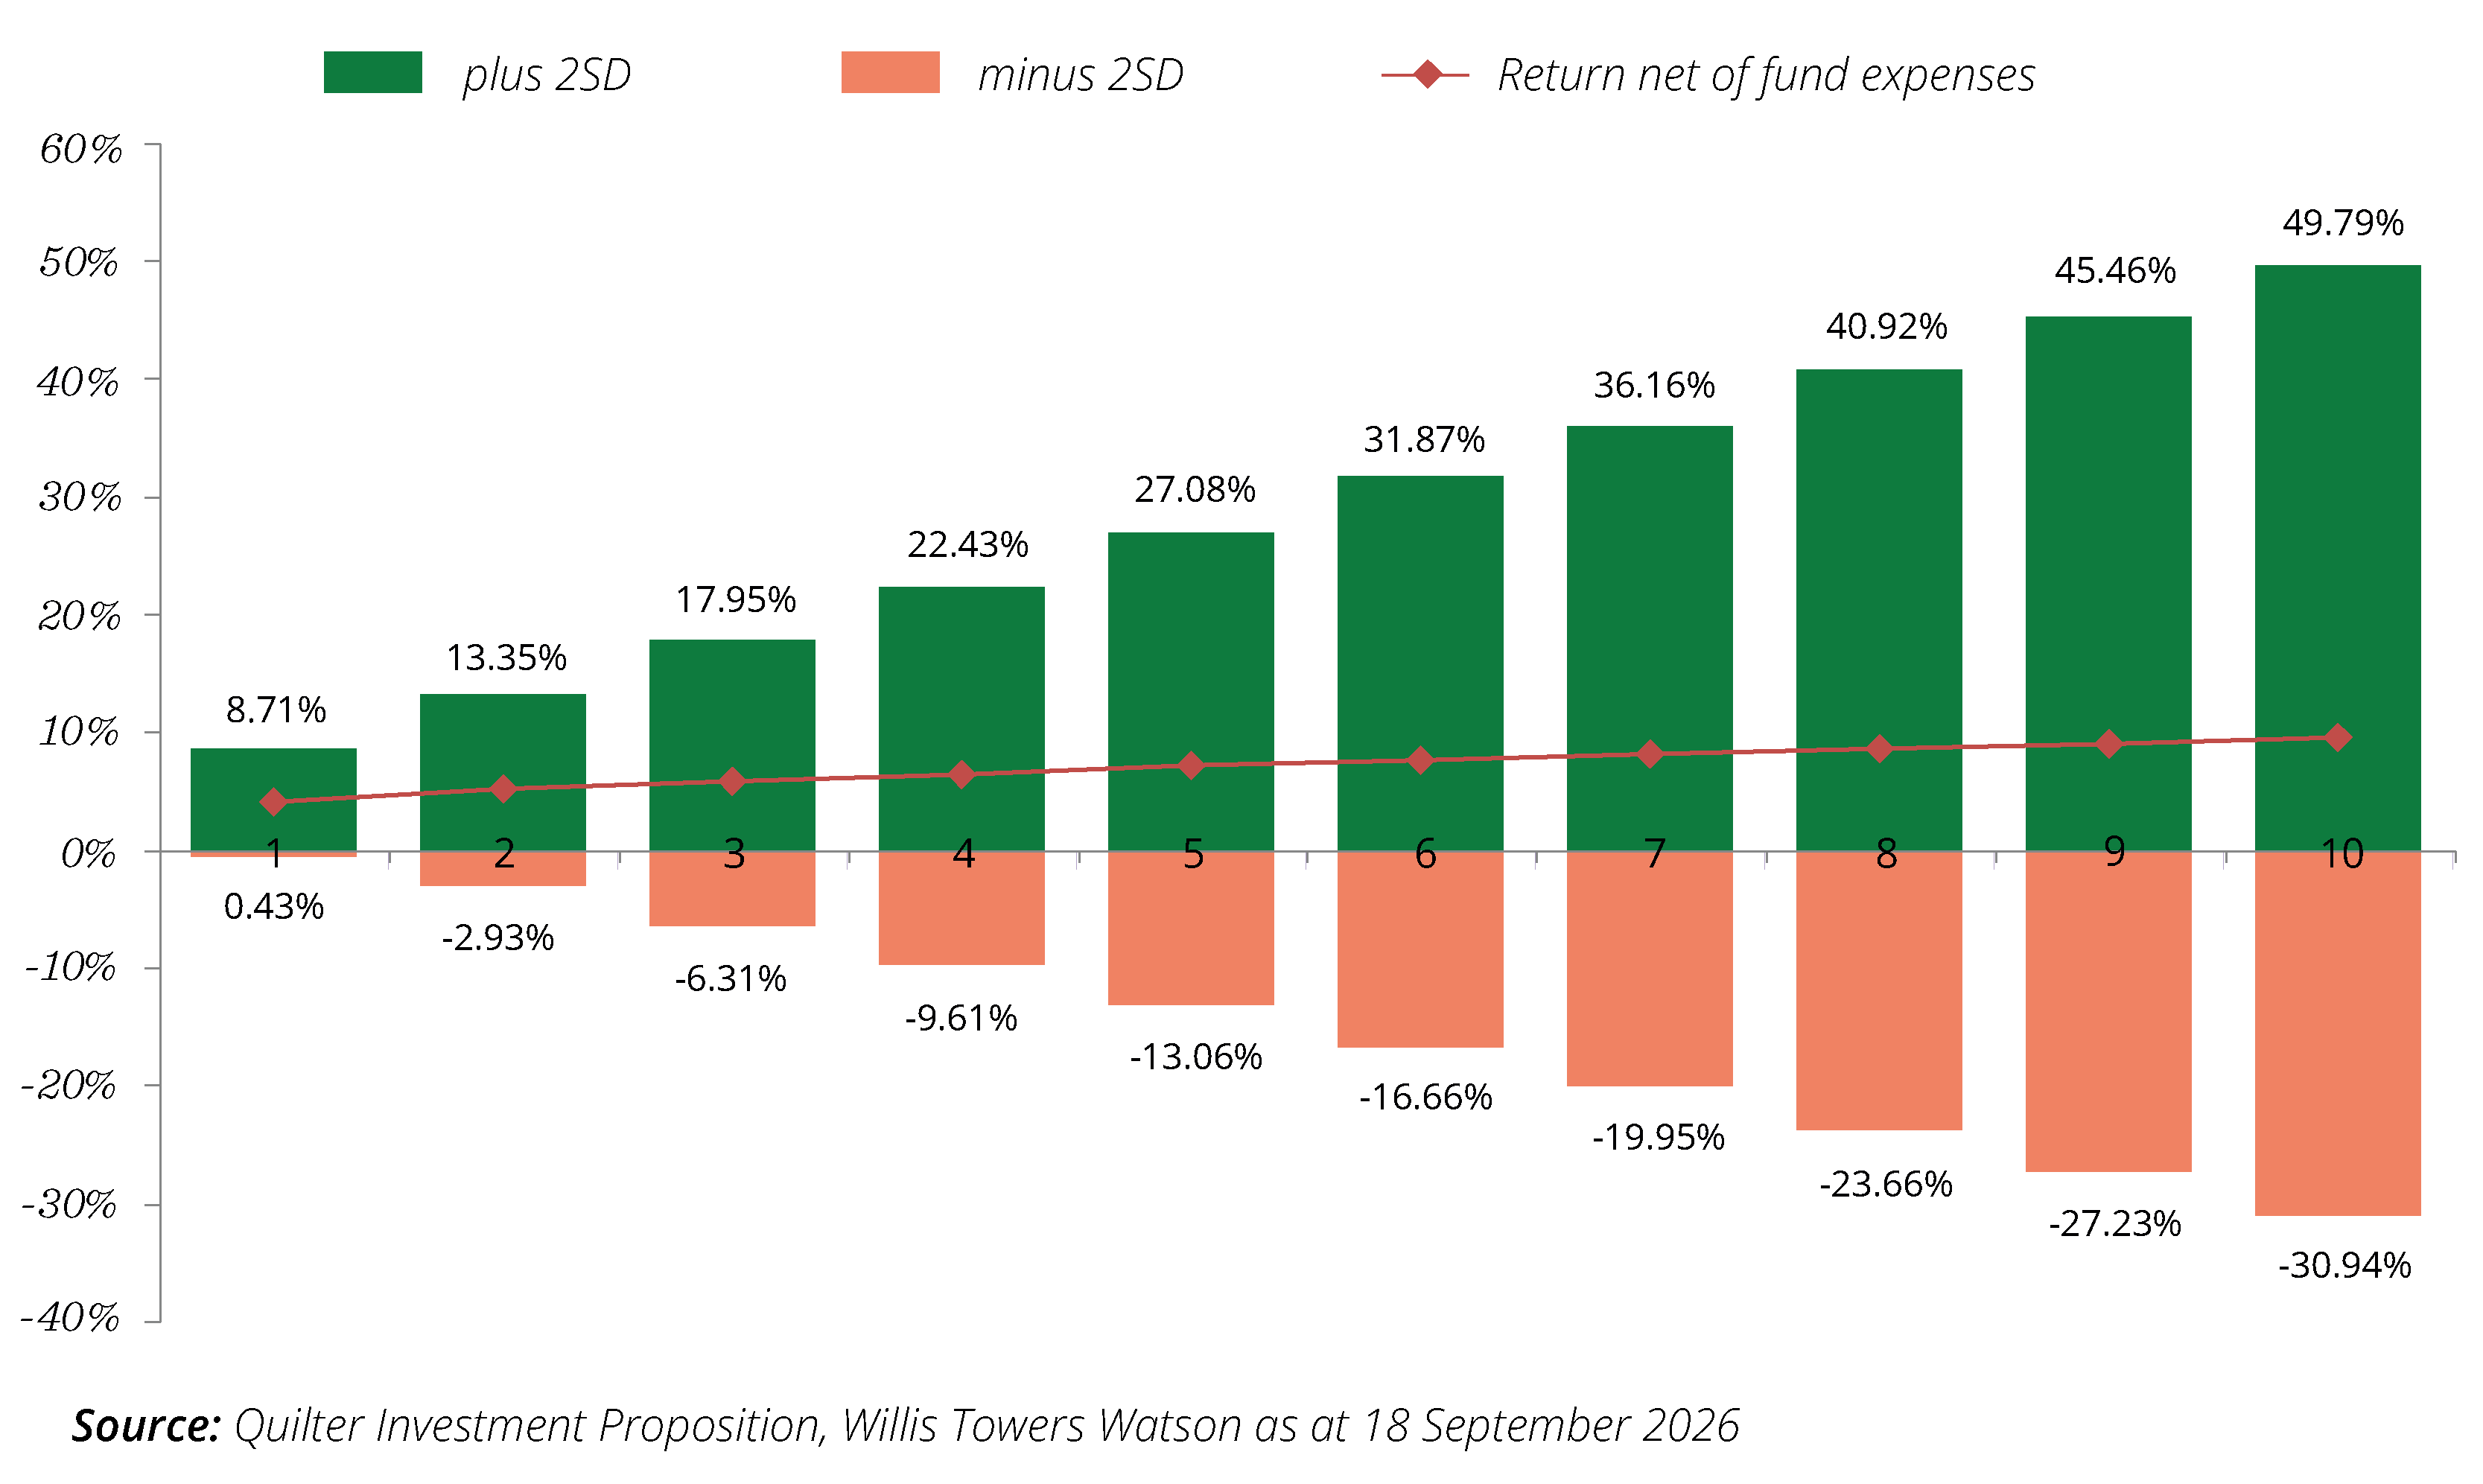
Returns and volatilities as at 18 September 2026
| RPI | Cash/Money Markets | Property | UK Fixed Interest | Int'l Fixed Interest | UK Equity | Int'l Equity |
|
| Gross Return | 2.75% | 4.01% | 8.17% | 5.46% | 4.95% | 9.03% | 9.58% |
| Return Net of Assumed Fund expenses | 2.75% | 3.96% | 6.17% | 5.41% | 4.90% | 8.58% | 9.45% |
| Volatility | N/A | 1.25% | 9.66% | 7.70% | 6.70% | 17.93% | 20.40% |
*Gross of tax and charges
(based on return and volatility assumptions)
Correlation matrix as at 18 September 2026 – five-year nominal returns
| Cash / Money Markets | Property | UK Fixed Interest | International Fixed Interest | UK Equity | International Equity | |
| Cash / Money Markets | 1.00 | -0.03 | -0.40 | 0.05 | 0.02 | 0.02 |
| Property | -0.03 | 1.00 | 0.29 | 0.12 | 0.72 | 0.67 |
| UK Fixed Interest | -0.40 | 0.29 | 1.00 | 0.23 | 0.34 | 0.26 |
| International Fixed Interest | 0.05 | 0.12 | 0.23 | 1.00 | 0.10 | 0.45 |
| UK Equity | 0.02 | 0.72 | 0.34 | 0.10 | 1.00 | 0.73 |
| International Equity | 0.02 | 0.67 | 0.26 | 0.45 | 0.73 | 1.00 |
Approver: Quilter September 2026
Q 00778/206/18657